
Oil Analysis Trending vs. Alarm Limits
Many static alarm limits are based on statistical analysis of a common grouping of machines under similar operating conditions. As long as machine is operated under similar conditions (load, speed, temperature, ambient environment) for a similar sampling and drain interval, the limits may have merit.
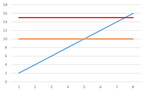
Figure 1
When any variable is different, the limit quickly loses relevance. The most common variable is the sampling interval, as most limits are set for an end-of-service (scheduled drain) interval or as a condemning limit. Samples taken early in the expected life of the lubricant usually have significantly lower results than these limits, so the alarm limit is perceived as being set too high.
When an alarm is set too high, the risk is that the lubricant or the machine may enter into a failure mode without setting off an alarm.
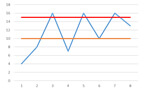
Figure 2
Conversely, if an alarm limit has been set too low for the operating conditions or drain interval, the result is an ever-present alarm on the lubricant and/or the machine. This typically results in a “cry wolf” effect where alarms end up being ignored, even if they represent a true failure mode.
Another issue, typically seen when desiring condition-based oil drains, or simply extending drain intervals, is referred to as the eventuality factor. Given a long enough service interval on the lubricant, the alarm should eventually be exceeded, yet, for many parameters, this does not necessarily signify a problem. (see figure 1).
Lastly, over-reliance on alarms tends to shift the focus from detecting an underlying trend that may serve to truly predict a failure before it occurs, to whether or not the lubricant or machine is simply in alarm. (see figure 2).
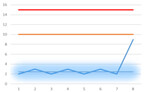
Figure 3
Using linear regression as the predominant method for evaluating the data eliminates such problems. Linear regression begins on the fourth sample from the same machine, as a minimum of data is required for the calculations to be practical. Based on historical data, the software predicts a range for the latest result; data within this range is considered normal for that individual machine, therefore alarms may appear at differing values for similar machines.
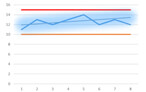
Figure 4
Static alarm limits can still be applied as a secondary evaluation, which may be necessary if certain targets must remain for warranty/service agreements, or for regulatory compliance, or until enough historical data has been obtained.
In cases where an existing alarm limit has been set too high, linear regression is able to trigger an alarm even if the value is well below the limit. (see figure 3).
In cases where the alarm limit is too low for the given operating conditions, linear regression rewards consistency and will not trigger an alarm even when it is above the limit. (see figure 4).
The eventuality factor is also dealt with, as steady changes are expected with continued service on the lubricant. Only cases where the rate changes significantly will be alarmed, while normal trend will not be alarmed even when the static limit has been exceeded.
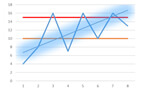
Figure 5
Underlying trends are also identified, providing more feedback to the end-user, even in situations where the lubricant or machine is constantly going in and out of alarm (often due to fluid changes). (see figure 5).
One fringe benefit that linear regression offers is identification of an abnormality that is both below an alarm limit and below historical results. Typically, this data would be ignored under the presumption that previous results were worse and no failure occurred. (see figure 6).
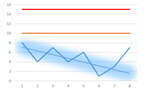
Figure 6
Another benefit is identification of an abnormality under the guise of a significant improvement. Often, results close to new oil values are perceived as ideal, however, in some cases, a sudden departure from a trend, even towards new oil values, indicates a serious concern. (see figure 7).
Trending provides greater depth to the interpretation, allowing for more relevant alarms that account for variations in operating conditions, and providing an ability to predict and anticipate a future sample exceeding an alarm, instead of waiting for the alarm and having to react with greater immediacy.
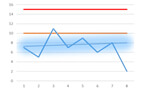
Figure 7